Goal scoring patterns over the
course of a match:
Analysis of Women’s high standard
soccer matches
Armatas, V., Yiannakos, A.,
Galazoulas, Ch., Hatzimanouil, D.
Sports Performance And Coaching Laboratory
Department of Physical Education and Sports Sciences
Aristotle University of Thessaloniki,
Greece.
Address for correspondence:
Dr. Galazoulas Christos,
Department of Physical Education and Sports Science,
Aristotle University of Thessaloniki,
Thessaloniki 540 06, Greece.
Tel. +302310 992471
Fax: +302310 992471
e-mail: galaz@phed.auth.gr
|
ABSTRACT
The purpose of this study was to
record the time that goals were scored
in the course of women’s high standard soccer matches. All matches
(n=90)
of the three latter women’s World Cups were recorded using video and
analyzed with computerized match analysis hardware and video playback
system for game performance analysis using Sportscout. Chi-square
methods were used for the data analysis and the level of significance
was set in p<0.05. The 45-min period analysis revealed that in World
Cups
1999 and 2003 most goals were scored in the second half (p<0.05),
while in the World Cup of 1995 no significant differences were observed
although the second half presented a greater percentage of goals
(53.5%). Τhe 15-min period
analysis presented that in World Cup of 1995 most goals were scored in
the
last period (76-90 min, p<0.05). Also in World Cups 1998 and 2002
there was presented a trend towards more goals scored as time
progressed. The results revealed that goal scoring in women’s soccer
matches might be dependant on time and specifically that more goals are
scored as time progresses. The above could be explained by the
deterioration in physical conditioning, the tactical play, fluid
balance and lapses in concentration.
Key words: women, soccer, goal, frequency, video-analysis.
|
Introduction
Women's soccer is a rather new sport that presents an upheaval
blossoming over the last decade (Konstadinidou & Tsigilis, 2005).
Its international recognition was not achieved until 1991, when the
first women’s World Cup was held in China. Moreover, in 1996 it was
introduced into Olympics’ games program.
Low frequency of scoring is one of soccer’s characteristics; thus, an
objective evaluation of the specific characteristics of scoring, that
directly determines the factors that ultimately lead to successful
attempts and goals, is imperative (Yiannakos & Armatas, 2006).
Analyses that studied the relationship between time and goal scoring
patterns in men’s soccer presented ambiguous results, some support that
the frequency of goals scored during a match is time dependent, (Saltas
& Ladis, 1992; Ridder, Cramer & Hopstaken, 1994; Reilly, 1996;
Abt, Dickson & Mummery, 2002; Bekris, Louvaris, Souglis, Hountis
& Siokou, 2005; Sotiropoulos, Mitrotasios & Travlos, 2005;
Yiannakos & Armatas, 2006) while others purport that there is no
immediate correlation between them (Jinshan, 1986; Michailidis et al.,
2004).
There are few studies, to our knowledge, that have studied performance
analysis in women's soccer. Miyamura, Susuma and Hisauki (1997)
compared women’s soccer matches, from various tournaments (World Cup
1991, PanAsia Cup, 2 final matches from University championship), to
men’s matches recording the time that the ball was ‘in game’. Results
revealed that men had the ball ‘in game’ for a longer time. Also, there
were differences found between women’s tournaments and specifically in
the World Cup where it was reported that players kept the ball ‘in
game’ longer when compared to the other two women’s tournaments. The
above underlined the qualitative differences that exist between teams.
Other research from Olsen and Larsen (1997) who studied Norway’s
national team’s offensive tactics concluded that long passes and the
usage of the defensive region for the beginning of offence are both
characteristics of Norway’s soccer. In a more recent study
Konstadinidou and Tsigilis (2005) studied the offensive tactics of four
top (quarter finalists) teams of the 3rd Women's World Cup.
Because women's soccer is a rather new sport there is a lack in
studies, unlike men’s soccer, that observed the characteristics of
women’s soccer and more specifically, there was no study found that
examined the relationship between time and goal scoring patterns. Thus,
the purpose of this study was to record the time that goals were scored
in high standard women’s soccer matches, in order to determine the
coefficient of dependence.
Methods
Subjects:
Ninety (90) soccer games from the three latter women’s World Cups
(World Cup 1995 – Sweden 26 matches, World Cup 1999 – USA 32 matches
and World Cup 2003 - USA 32 matches) were studied. The reason for the
selection of this tournament was the participation of top international
women’s teams.
Study Design - Instrumentation
The soccer games were videotaped and digitized with the help of a Sony
video SLV-SE 210D, a PC AMD-XP professional 1333 GHz and a television
capture board for PC (PCTV, Pinnacle Systems GmbH, Braunschweig,
Germany). The study was based on the researcher’s personal observation
who recorded the time that goals scored. The Sportscout video-analysis
program for PC was used for the data recording.
The analysis’ variables were: 1) the frequency of goal scoring per 45
minutes (two periods: 1-45+ min, 46-90+ min), 2) the frequency of goal
scoring per 15 minutes (six periods: 1-15min, 16-30min, 31-45+ min,
46-60min, 61-75min, 76-90+ min). The observation of the chosen soccer
games was conducted in the department of Technical and Tactical
Analysis in the Laboratory of Sports Performance and Coaching.
Data Analysis
All data were analyzed using the statistical package for PC SPSS 12.0.
Chi-square analysis was used to determine the statistically significant
differences and the level of significance was set at p<0.05.
Results
Figure one exhibits the frequency of goal scoring in World Cup
1995 as this is examined in time-basis of 45 minutes. Although more
goals were scored in the second half, no statistically significant
difference presented in goals scored between the first and second half
(53.5 vs. 46.5, p>0.05).
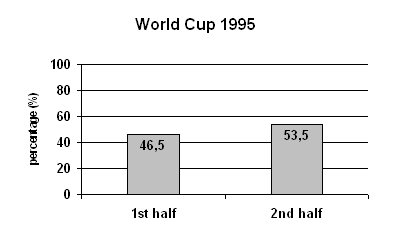
Figure 1: Frequency of goal scoring / 45 min.
In the World Cup of 1999 the percentage of goal scoring frequency was
42.3% for the 1st half and 57.7% for the 2nd half (figure 2). The
statistical analysis showed a significant difference between 2nd and
1st half (57.7 vs. 42.3, x2=4.63, p<0.05).
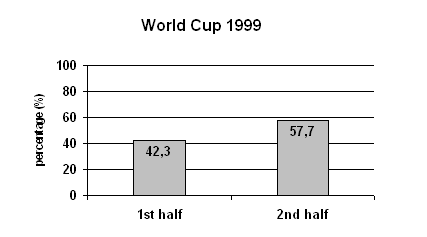
Figure 2 Frequency of goal scoring / 45 min.
In Figure 3 is presented the frequency of goal scoring in the latter
World Cup that took place in the USA. The statistical analysis showed
significant difference between the two halves (58 vs. 42, x2=5.12,
p<0.05)
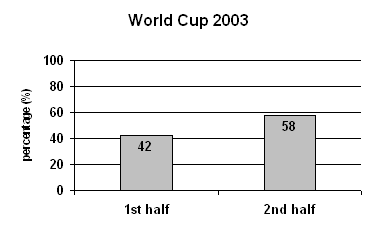
Figure 3 Frequency of goal scoring / 45 min.
The 15-min analysis of goals in World Cup 1995 (figure 4) showed
that the majority of the goals were scored in the last 15-min period
(75-90+). Also there was a trend observed of more goals being scored in
the last periods of the two halves (31-45 min and 76-70 min).
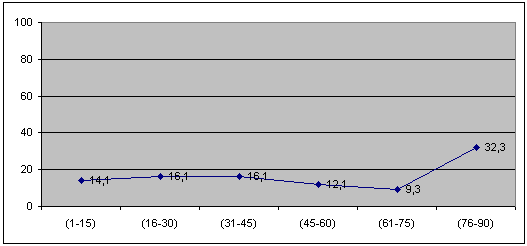
Figure 4: Frequency of goal scoring / 15 min.
In the World Cup of 1999 the results of the goal scoring frequency
showed that the majority of the goals were scored in the three last
15-min periods of the match . Although there was a trend for more goals
scored as time progressed, there was not any statistically significant
differences between the six periods of time.
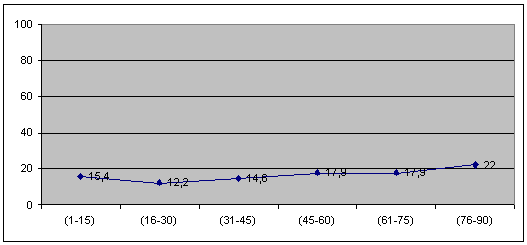
Figure 5: Frequency of goal scoring / 15 min.
Finally, in the latter women’s World Cup it was also observed that more
goals are scored as time progresses. Moreover, more goals are scored in
the last three periods of time. The last period presented a significant
difference towards the first (24.3 vs. 10.3, x2=6.84, p<0.05).
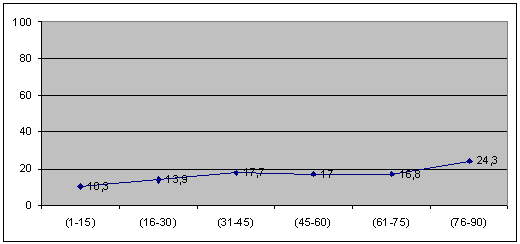
Figure 6: Frequency of goal scoring / 15 min.
Discussion
The purpose of this study was to record the time that the goals were
scored in high standard women’s soccer matches, in order to conclude
the coefficient of dependence. There were no studies found to
examine the relationship between time and goal scoring in women’s
soccer. The review of relevant studies that concentrated on the
relationship between time (per half time or per 15-min) and goal
scoring patterns in men’s soccer matches revealed ambiguous results.
Physiological data for female soccer players show similar differences
from the general population to those observed in their male
counterparts (Shephard, 1999). Aerobic power has been reported to be
47-49 ml · kg-1 · min-1 in collegiate players ( Rhodes
& Mosher, 1992), 52 ml · kg-1 · min-1 in English
players who underwent a period of concentrated training (Davis et al.,
1992) and 54.7 ml · kg-1 · min-1 in the Japanese national
team (Kohno et al., 1991). The mean distance covered during a game was
reported to be 8500 m, blood lactate concentrations were 5.1 and 4.6
mmol · l-1 at half time and at the end of a game respectively,
and mean heart rates were in the range 173-177 beats · min-1
(Davis & Brewer, 1993).
The lean body mass of female soccer players is ~ 44 kg (Colquhoun &
Chad, 1986) and body fat can account for as much as 21± 22% of
body mass (Davis & Brewer, 1993), although Canadian intercollegiate
players have values around 16% (McKay & Shephard, 1988). Knee
extension and flexion forces are substantially less than in male
players (Kohno et al., 1991), but flexibility is greater in women
(Nyland et al., 1997). An inadequate intake of energy is less common in
soccer players than in some other female athletes (Borgen & Corbin,
1987). Nevertheless, one study indicated that eight of nine female
players were trying to lose weight during the playing season, with
calcium and iron intake 30% below recommended values (Nutter, 1991). A
possible influence of premenstrual syndrome on performance was
suggested by an increased risk of traumatic injury during the
premenstrual and menstrual phases of the ovulatory cycle; injuries were
less frequent in those taking oral contraceptives (Mωller-Nielsen &
Hammar, 1989).
The huge differences observed in aerobic power within women subjects
may have a connection with the level of women’s soccer in general.
Differences in physical resources, determined as strength and endurance
parameters, between male and female elite soccer teams, are similar to
their sedentary counterparts (Stolen, Chamari, Castagna & Wisloff,
2005). This means that compared with sedentary counterparts within the
same sex, the female elite soccer players have improved as much as the
male elite soccer players. Therefore, there is no reason to claim that
female soccer has shortcomings compared with elite male soccer in terms
of strength and endurance (Helgerud, Hoff & Wisloff, 2002).
From the above it is clear that although there were no similar studies
found which examined the relationship between time and goal scoring
patterns in women’s soccer, the causes for more goals scored as time
progresses could be similar to those for men.
From a purely physiological perspective there is a strong body of
knowledge supporting a reduction in physical condition over the course
of a match leading to a state of fatigue and reduced physical
performance (Saltin, 1973; Bangsbo, 1994). However, it appears that
physical condition may not influence goal-scoring ability (Abt et al.,
2002). Studies by Zeederberg et al. (1996) and Abt et al. (1998) have
shown that neither carbohydrate depletion nor supplementation appears
to influence the performance of game related skills such as shooting.
As such, maintenance of shooting ability as a match progresses would
further aid attackers in gaining an advantage over defenders.
The appearance of fatigue that was mentioned above can be presented
easily from diverse factors. Several studies that worked on time-motion
analysis of men’s soccer matches have provided evidence that players’
ability to perform high intensity exercise is reduced towards the end
of games in both elite and sub-elite soccer (Krustrup et al., 2006;
Mohr et al., 2004a; Mohr, Krustrup & Bangsbo, 2005; Drust, Reilly
& Rienzi, 1998; Van Gool, Van Gerven & Boutmans, 1988). Thus,
it has been demonstrated that the amount of sprinting, high-intensity
running, and distance covered are lower in the second half than in the
first half of a game (Bangsbo, Nψrregaard & Thorsψe, 1991; Bangsbo,
1994; Mohr, Krustrup & Bangsbo, 2003; Reilly & Thomas, 1979).
Furthermore, it has been observed that the amount of high-intensity
running is reduced in the final 15 min of a top-class soccer game (Mohr
et al., 2003) and that jumping, sprinting and intermittent exercise
performance is lowered after versus before a soccer game (Mohr,
Krustrup, Nybo, Nielsen & Bangsbo, 2004b; Mohr, Krustrup, &
Bangsbo, 2005; Rebelo, 1999). In a review of the prolonged run-up,
which the Korean team adopted in preparing for the 2002 World Cup
Finals, Verheijen (2003) described how initially the team could not
keep up the desired pace of the game for the full 90 min. Players made
high intensity runs less frequently and fewer explosive actions as the
second half progressed. This reduction may indicate the development of
fatigue in the second half, although total distance covered appears not
to be a perfect indicator of physical performance in a match (Bangsbo,
1994). From the above it is clearly seen that in second half, and more
specifically towards the end of the match, fatigue that players face
leads them to make mistakes and as a result, more goals are scored. The
physiological mechanisms responsible for fatigue appear to change
during different periods of a match. Temporary fatigue may be related
to disturbed muscle ion homeostasis. Impaired exercise ability in the
first few minutes after half-time could be explained by a markedly
lowered muscle temperature at the start of the second half. The
decrement in the last stage of a game may be caused by a depletion of
muscle glycogen in individual fibres, and under thermal stress
conditions also dehydration and the concomitant hyperthermia (Mohr et
al., 2005).
Another possible factor of higher scoring frequency towards the end of
a match is the tactics. In the study by Mohr et al. (2003), within each
playing position there was a significant variation in the physical
demands depending on the tactical role and the physical capacity of the
players. As far as the tactical factor is concerned, Reilly (1996)
reports that play may become urgent towards the end of play as teams
chase a result. Although, an “urgent” game is difficult to quantify, it
would appear that the players are more willing to take greater risks
towards the end of a match in order to affect an outcome (Abt et al.,
2002). It is also possible that the losing team pushes players forward
in order to create scoring opportunities, thereby scoring themselves or
conceding further goals (Reilly, 1997). Mohr et al. (2003) supported
that the reduced amount of high-intensity work at the end of the game
was related to the fact that the outcome of the match had been decided.
Factors such as dehydration and hyperthermia may also contribute to the
development of fatigue in the later stages of a soccer game (Magal et
al., 2003; Reilly, 1997) and influence goal scoring patterns. Soccer
players have been reported to lose up to 3 litres of fluid during games
in temperate thermal environments and as much as 4 – 5 litres in a hot
and humid environment (Bangsbo, 1994; Reilly, 1997), and it has been
observed that 5 and 10m sprint times are slowed by hypohydration
amounting to 2.7% of body mass (Magal et al., 2003). Moreover,
cognitive function is diminished in the hypohydrated state (Reilly
& Lewis, 1985), possibly leading to a reduction in decision making
ability and/or skill performance. However, in the study by Krustrup et
al. (2006) a significant reduction in sprint performance was observed,
although the fluid loss of the players was only about 1% of body mass,
and no effect on core or muscle temperature was observed in a study
with a similar loss of fluid (Mohr et al., 2004b). Also, Hoffman,
Stavsky and Falk (1995) reported no decrease in shooting ability during
a simulated basketball game, despite fluid losses approaching 2% of
body mass. Thus, it would appear that fluid loss is not always an
important component in the impaired performance seen towards the end of
a game. Finally, icy or waterlogged surfaces are likely to impair all
movements, whereas high altitudes or very hot conditions predispose to
fatigue in the second half of a match (Reilly, 1994).
The last factor of goal scoring patterns is lapses in concentration of
the players. Abt et al. (2002) concluded that higher percentage of
scoring before half time and in the final 5 min of the game, are
derived from lapses in concentration.
The results of the present study indicated that women’s soccer is
similar to men’s soccer as far as the relationship between time and
goal scoring patterns are concerned. Previous studies in men’s soccer,
as presented before, concluded that goal scoring patterns are time
depended. Specifically, it was shown that more goals were scored in the
second half and that as time progresses in soccer matches more goals
were scored. In conclusion, women’s soccer seems to accord with men’s
soccer’s trend for more goals scored as time progresses and it could be
explained by the deterioration in physical conditioning, the tactical
play, fluid balance and lapses in concentration.
References
- Abt, G., Zhou, S. and Weatherby, R. (1998). The effect of high
carbohydrate diet on the skill performance of midfield soccer players
after intermittent treadmill exercise. Journal of Science and Medicine
in Sport. 1, 203-212.
- Αbt, G.A., Dickson, G. and Mummery, W.K. (2002). Goal scoring
patterns over the course of a match: An analysis of the Australian
National Soccer League. In Science and Football IV (Eds Spinks, W.,
Reilly, T., Murphy, A.) Routledge London, pp 107-111.
- Bangsbo, J. (1994). The physiology of soccer - with special
reference to intense intermittent exercise. Acta Physiologica
Scandinavica, 151 (Suppl. 619), 1-155.
- Bangsbo, J., Nψrregaard, L. and Thorsψe, F. (1991). Activity
profile of competition soccer. Canadian Journal of Sports Sciences, 16,
110 – 116.
- Bekris, E., Louvaris, Z., Souglis, S., Hountis, K. and Siokou, E.
(2005). Statistical analysis of the ability of shot in high standard
matches. 1ο International Scientific Congress in Soccer, 8-10 April,
Trikala, Greece.
- Borgen, J.S. and Corbin, C.B. (1987). Eating disorders among
female athletes. Physician and Sportsmedicine, 15, 89- 95.
- Colquhoun, D. and Chad, K.E. (1986). Physiological
characteristics of Australian female soccer players after a competitive
season. Australian Journal of Science and Medicine in Sport, 18, 9- 12.
- Davis, J.A. and Brewer, J. (1993). Applied physiology of female
soccer players. Sports Medicine, 16, 180- 189.
- Davis, J.A. and Brewer, J. (1992). Physiological characteristics
of an international female soccer squad. Journal of Sports Sciences,
10, 142- 143.
- Drust, B., Reilly, T. and Rienzi E. (1998). A motion-analysis of
work-rate profiles of elite international soccer players 2nd Annual
Congress of the European College of Sport Science, 20-23 August,
Copenhagen, Denmark. In Journal of Sports Sciences, 15, 5, p. 460.
- Helgerud J, Hoff J, Wislψff U. (2002). Gender differences in
strength and endurance of elite soccer players. In Science and Football
IV (Eds Spinks, W., Reilly, T., Murphy, A.) Sydney: Taylor and
Francis, 382.
- Hoffman, R., Stavsky, H. and Falk, B. (1995). The effect of water
restriction on anaerobic power and vertical jumping height in
basketball players. International Journal of Sports Medicine, 16,
214-218.
- Jinshan, X. (1986). The analysis of the techniques, tactics and
scoring situations of the 13th World Cup. Sandong Sports Science and
Technique (April), 89-91.
- Kohno, T., O’Hata, N., Shirata, T., Hisatomi, N., Endo, Y.,
Onodera, S. and Sato, M. (1991). Physical characteristics of Japan
women’s National team soccer players. Communication to the Conference
on Sport for All, UKK Institute, Tampere, Finland.
- Konstadinidou, X., Tsigilis, N. (2005). Offensive playing
profiles of football teams from the 1999 Women's World Cup Finals.
International Journal of Performance Analysis in Sport (electronic),
5(1), pp. 61-71.
- Krustrup, P., Mohr, M., Steensberg, A., Bencke, J., Kjζr, M. and
Bangsbo, J. (2006). Muscle and blood metabolites during a soccer game:
Implications for sprint performance. Medicine and Science in Sports and
Exercise, 38(6), 1 – 10.
- Magal, M., Webster, M. J., Sistrunk, L. E., Whitehead, M. T.,
Evans, R. K. and Boyd, J. C. (2003). Comparison of glycerol and water
hydration regimens on tennis-related performance. Medicine and Science
in Sports and Exercise, 35, 150 – 156.
- McKay, L. and Shephard, R.J. (1988). Standardized Tests for
Canadian Soccer Players. Ottawa, ON: Canadian Soccer Association.
- Michailidis, C., Michailidis, I., Papaiakovou, G. and
Papaiakovou, I. (2004). Analysis and evaluation of way and place that
goals were achieved during the European Champions League of Football
2002-2003. Sports Organization, 2(1), 48-54.
- Miyamura, S., Susuma, S. and Hisauki, K. (1997). A time analysis
of men’s and women’s soccer. In Science and Football III (Eds Reilly,
T., Bangsbo, J., Hughes, Μ.) E. & F. Spon, London, pp. 251-257.
- Mohr, M., Krustrup, P. and Bangsbo, J. (2005). Fatigue in soccer:
A brief review. Journal of Sports Sciences, 23, 593 – 599.
- Mohr, M., Krustrup, P., Nybo, L., Nielsen, J. J. and Bangsbo, J.
(2004b). Muscle temperature and sprint performance during soccer
matches – beneficial effects of re-warm-up at half time. Scandinavian
Journal of Medicine and Science in Sports, 14, 156 – 162.
- Mohr, M., Nordsborg, N., Nielsen, J. J., Pedersen, L. D.,
Fischer, C., Krustrup, P. et al. (2004a). Potassium kinetics in human
interstitium during repeated intense exercise in relation to fatigue.
Pflugers Archive, 448, 452 – 456. In Bangsbo, J., Mohr, M. and Krustrup
P. (2006). Physical and metabolic demands of training and match-play in
the elite football player. Journal of Sports Sciences, 24(7): 665 –
674.
- Mohr, M., Krustrup, P. and Bangsbo, J. (2003). Match performance
of high-standard soccer players with special reference to development
of fatigue. Journal of Sports Sciences, 2003, 21, 519–528.
- Mωller-Nielsen, J. and Hammar, M. (1989). Women’s soccer injuries
in relation to the menstrual cycle and oral contraception use. Medicine
and Science in Sports and Exercise, 21, 126- 129.
- Nutter, J. (1991). Seasonal changes in female athletes’ diets.
International Journal of Sports Nutrition, 1, 395- 407.
- Nyland, J.A., Caborn, D.N.M., Brosky, J.A., Kueller, C.L. and
FriedhoV , G. (1997). Anthropometric, muscular fitness, and injury
history comparisons by gender of youth soccer teams. Journal of
Strength and Conditioning Research, 11, 92- 97.
- Olsen, E. and Larsen, O. (1997). Use of match analysis by coach.
In Science and Football III (Eds Reilly, T., Bangsbo, J., Hughes, Μ.)
E. & F. Spon, London, pp. 209-220.
- Rebelo, A. N. C. (1999). Studies of fatigue in soccer. PhD
thesis, University of Porto, Porto, Portugal.
- Reilly, T. (1997). Energetics of high intensity exercise (soccer)
with particular reference to fatigue. Journal of Sports Sciences, 15,
257-263.
- Reilly, T. (1996). Motion analysis and physiological demands. In
Science and Football III (Eds Reilly, T., Bangsbo, J., Hughes, Μ.) E.
& F. Spon, London, pp. 65-81.
- Reilly, T. (1994). Motion characteristics. In Football (Soccer)
(edited by B. Ekblom), pp. 31- 42. Oxford: Blackwell Scientific .
- Reilly, T. and Lewis, W. (1985). Effects of carbohydrate feeding
on mental functions during sustained exercise. In Ergonomics
International 85 (eds I.D. Brown, R. Goldsmith, K. Coombers, M.A.
Sinclair). Taylor and Francis, London, pp. 700-702.
- Rhodes, E.C. and Mosher, R.E. (1992). Aerobic and anaerobic
characteristics of elite female university soccer players. Journal of
Sports Sciences, 10, 143- 144.
- Ridder, G., Cramer, S. and Hopstaken, P. (1994). Down to ten:
estimating the effect of a red card in soccer. Journal of the American
Statistical Association, 89, 1124-1127.
- Saltas, P. and Ladis, S. (1992). Soccer and study in shots.
Thessaloniki, Greece.
- Saltin, B. (1973). Metabolic fundamentals in exercise. Medicine
and Science in Sports, 5, 137-146.
- Shephard, R.J. (1999). Biology and medicine of soccer: An update.
Journal of Sports Sciences, 17, 757- 786.
- Stψlen, T., Chamari, K., Castagna C. and Wislψff, U. (2005).
Physiology of Soccer. An Update. Sports Medicine, 35 (6): 501-536.
- Sotiropoulos, A., Mitrotasios, M. and Traulos, A. (2005).
Comparison in goal scoring patterns between Greek professional and
amateur teams. 1ο International Scientific Congress in Soccer, 8-10
April, Trikala, Greece.
- Van Gool, D., Van Gerven, D. and Boutmans, J. (1988). The
physiological load imposed on soccer players during real matchplay. In
T. Reilly, A. Lees, K. Davids, & W. J. Murphy (Eds.), Science and
Football (pp. 51 – 59). London/New York: E & F.N. Spon.
- Verheijen, R. (2003). Periodisation in football: Preparing the
Korean national team for the 2002 World Cup. Insight: The FA Coaches
Association Journal, 6(2), 30 – 33.
- Yiannakos, A. and Armatas, V. (2006). Evaluation of the goal
scoring patterns in European Championship in Portugal 2004.
International Journal of Performance Analysis in Sport (electronic),
6(1), 178-188.
- Zeederberg, C., Leach, L., Lambert, V., Noakes, D., Dennis, C.
and Hawley, A. (1996). The effect of carbohydrate ingestion on the
motor skill proficiency of soccer players. International Journal of
Sport Nutrition, 6, 348-355.